Dashboard Overview
The Durantic dashboard is a web-based interface for managing your hybrid infrastructure. From the dashboard you can register machines, assign roles, configure mesh networks, manage secrets, and monitor provisioning — all without touching a command line.
Navigation Structure
Top Bar
The top bar is visible on every page and contains two areas:
Left side — Main menu
| Menu Item | Description |
|---|---|
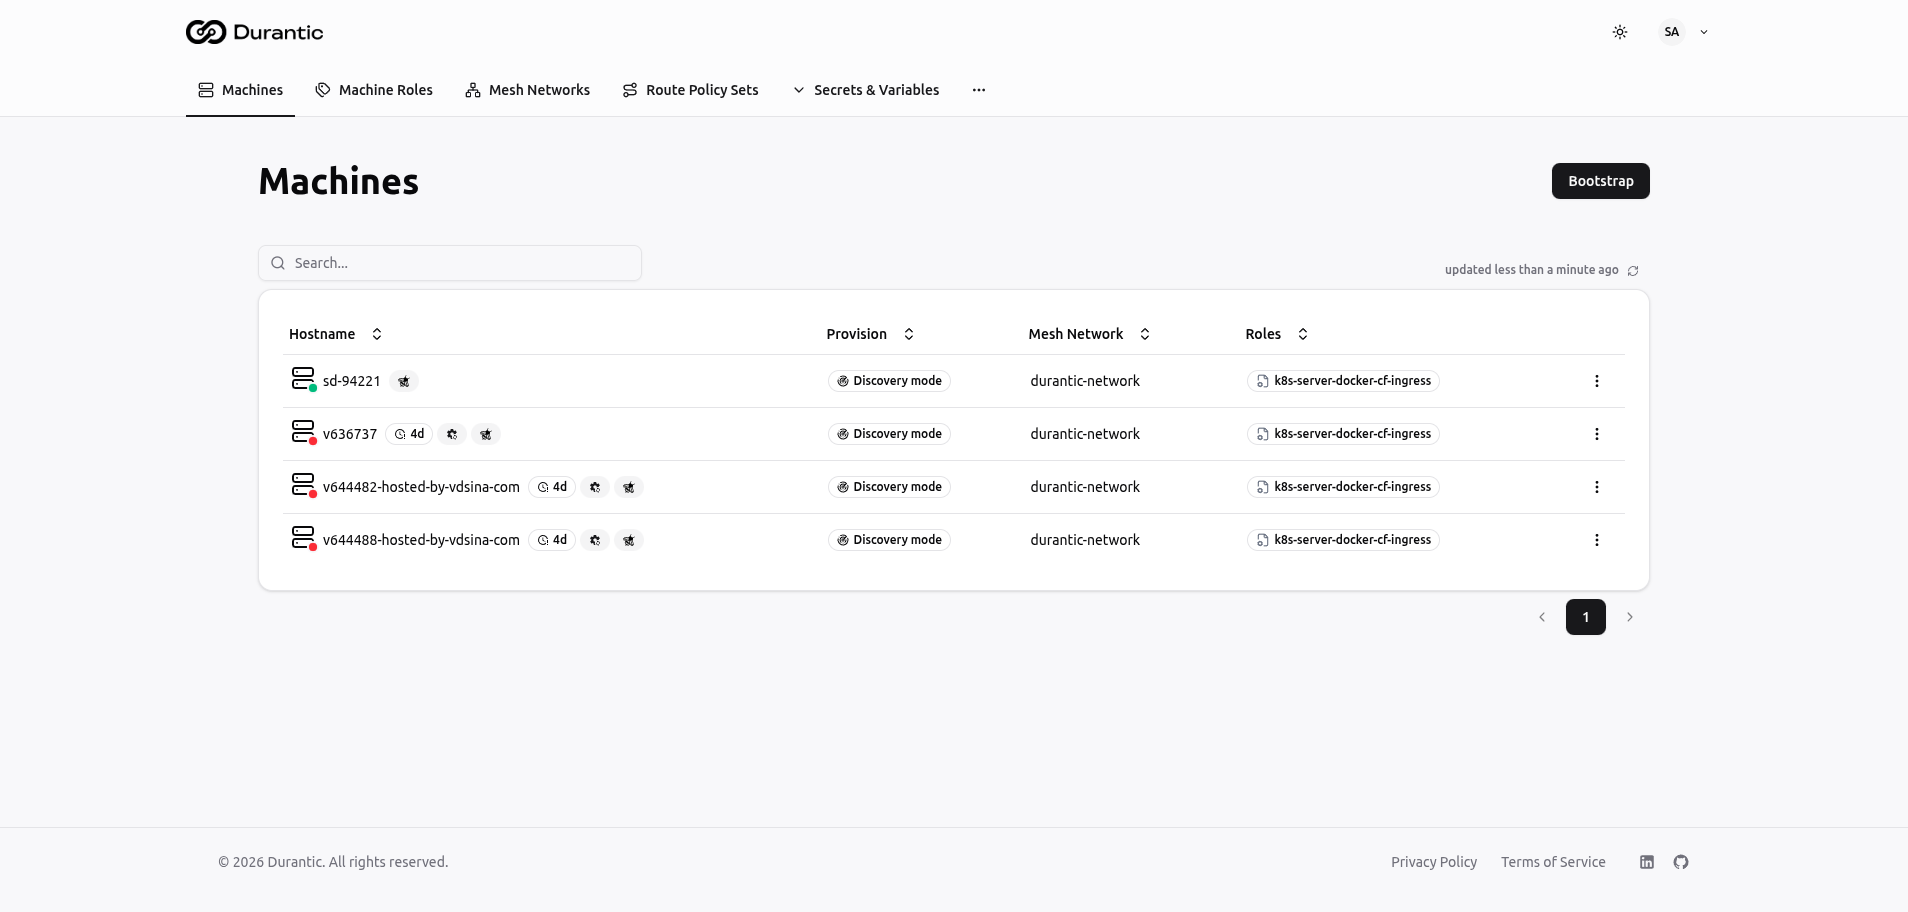
| Machines | List of all registered machines with online/offline status and provisioning state |
| Machine Roles | Reusable configuration templates that produce cloud-init YAML |
| Mesh Networks | WireGuard-based encrypted overlay networks connecting your machines |
| Route Policy Sets | BGP route filtering and manipulation rules |
| Secrets & Variables | Dropdown containing three sub-pages: Secrets, Variables, and Secrets Backends |
Right side — User controls
| Control | Description |
|---|---|
| Theme toggle | Switch between light, dark, and system-default themes |
| User menu | Avatar with initials, opens a dropdown with account settings and logout |
Footer
The footer displays copyright information, links to the Privacy Policy and Terms of Service, and social links.
Page Layout Patterns
The dashboard uses consistent layout patterns across all pages:
List Pages
List pages (Machines, Machine Roles, Mesh Networks, Route Policy Sets, Secrets, Variables) share this structure:
- Page title — Large heading at the top left.
- Action button — A primary button at the top right (Bootstrap, Create, etc.).
- Search bar — A text search field to filter the list.
- Auto-refresh indicator — Shows "updated less than a minute ago" with a refresh icon.
- Data table — Sortable columns with sort arrows. Click a column header to sort.
- Row actions — A three-dot menu on each row for edit, delete, and other actions.
- Pagination — Page numbers at the bottom of the table.
Detail Pages
Detail pages (individual machine, machine role) use a sidebar layout:
- Page title — Heading with the resource type and name displayed as a subtitle.
- Left sidebar — Navigation tabs grouped by category (General, Networking, Tools).
- Main content area — The content for the selected tab, which can be a form, table, or read-only display.
Common UI Patterns
Data Tables
Tables display sortable columns with ascending/descending sort indicators. All tables support text search and pagination. Rows are clickable to navigate to a detail view where applicable.
Create Dialogs
Clicking a "Create" button opens a dialog or navigates to a form page. Required fields are validated before submission.
Delete Confirmation
Deleting a resource shows a confirmation dialog to prevent accidental removal.
Real-Time Status Updates
Many pages display live data. The "updated less than a minute ago" indicator shows when data was last refreshed. The dashboard periodically polls for new data so you see changes without manually reloading.
Search and Filter
The search bar on list pages performs a text search across visible columns. Results update as you type.