Machine Detail
The machine detail page shows everything about a single machine. Click any hostname on the Machines list page to open it.
The page has a left sidebar with navigation tabs. The first set of tabs is ungrouped, followed by Networking and Tools groups:
- Configuration — Overview and editable settings
- Hardware — Detected hardware inventory
- Cloud Init — Rendered cloud-init configuration
- Provisions — Provisioning history and trigger
Networking - Network — Interfaces, NAT/STUN, routes - Routing — BGP Routing Information Base (RIB) - Endpoints — Observed public endpoints - Peers — Mesh network peer connectivity - Peer Map — Visual network topology map - Routes — BGP routes this machine announces - VIPs — Virtual IPs this machine announces
Tools - Terminal — Interactive remote shell
Configuration
The Configuration tab is the default view. It provides an editable form for the machine's key settings.
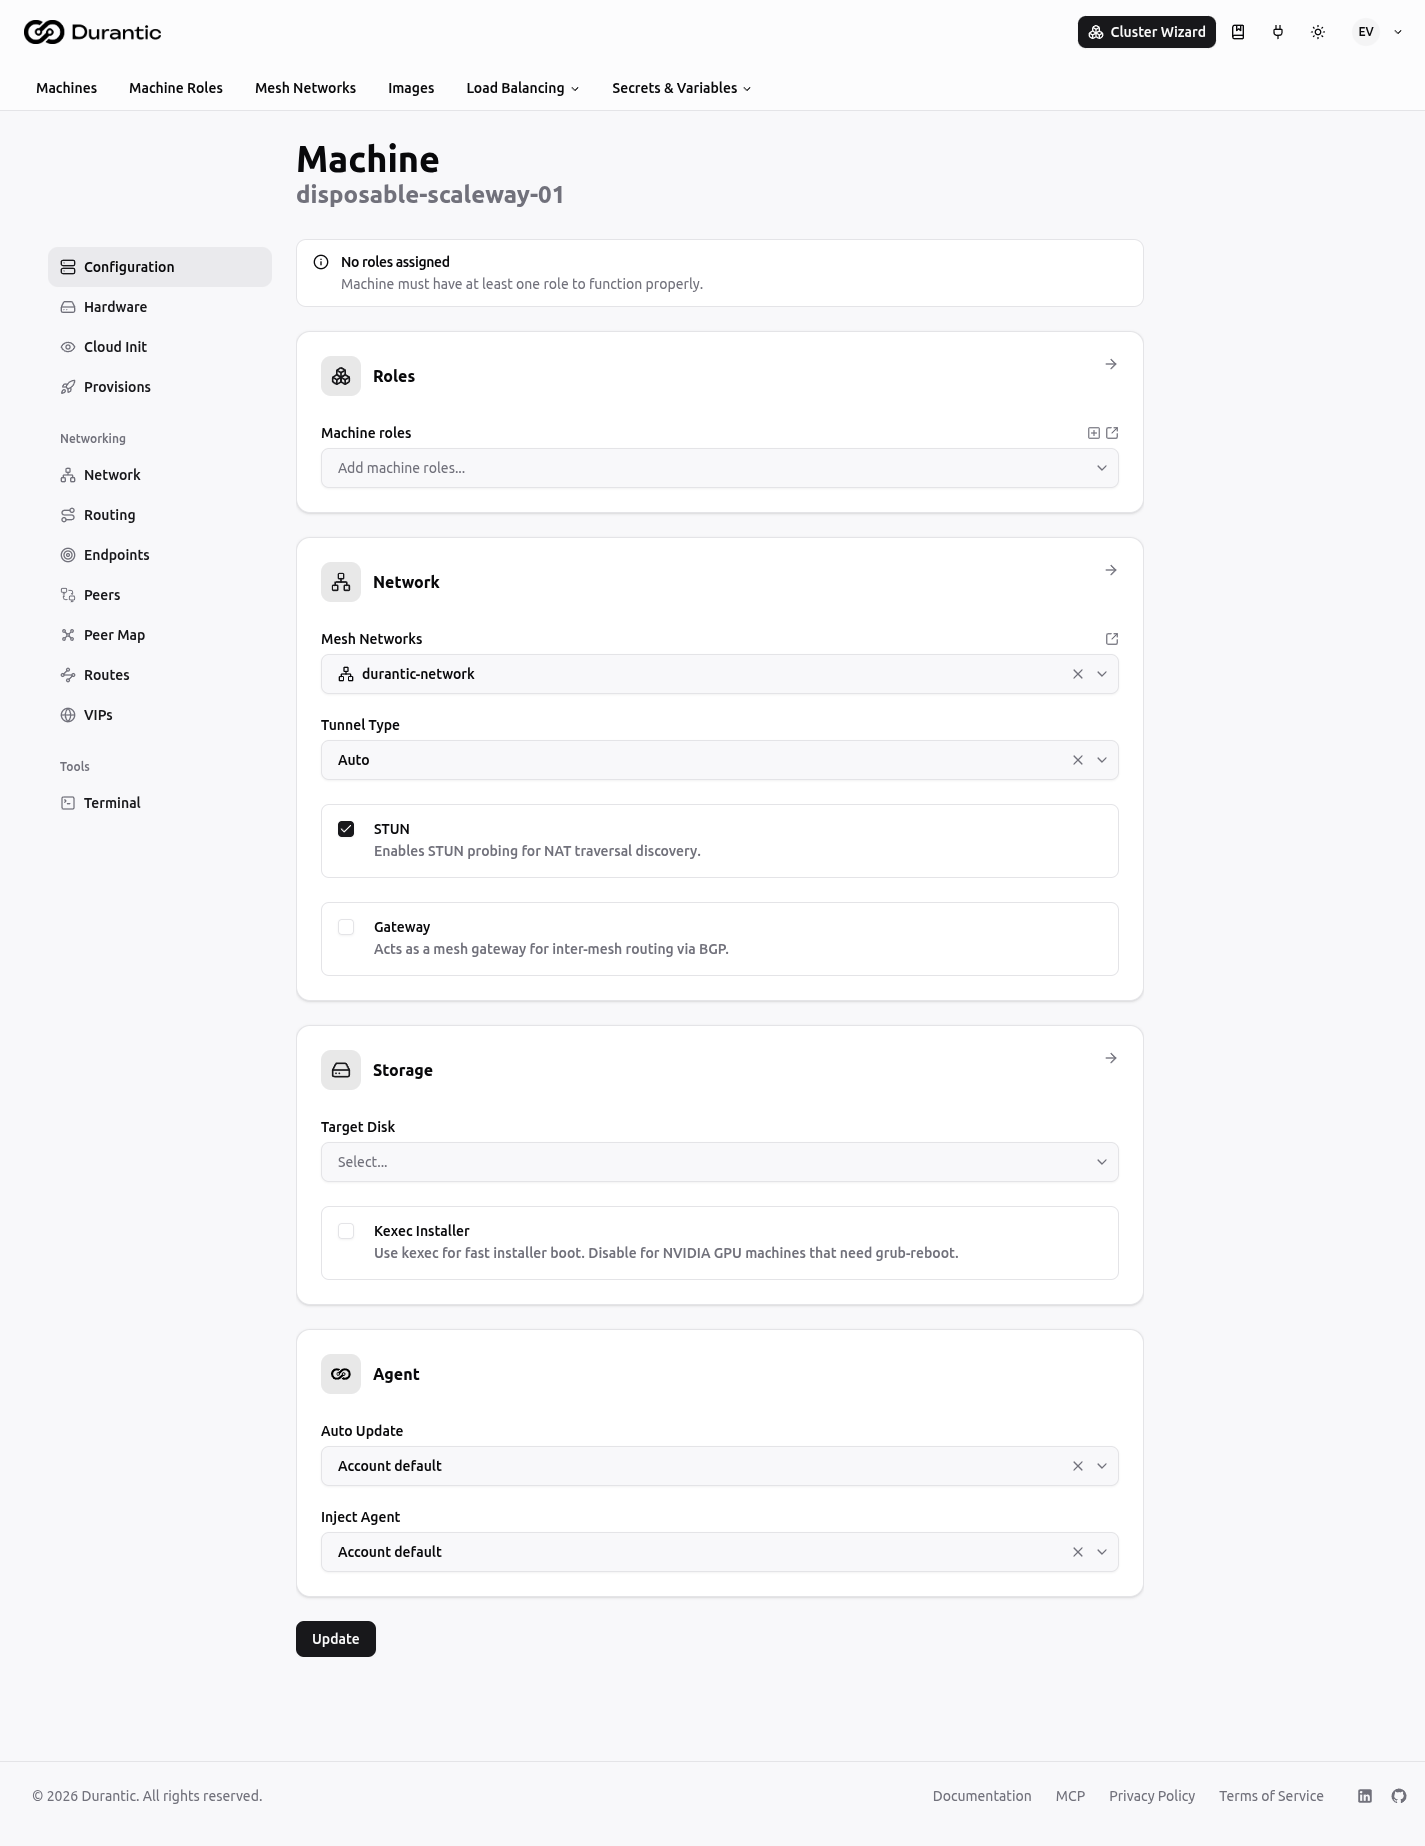
The tab is organized into four cards: Roles, Network, Storage, and Agent.
Roles
| Field | Description |
|---|---|
| Machine roles | Multi-select tag input. Assign one or more roles to the machine. Each role contributes to the final cloud-init configuration. Click the + icon to add roles, or click the x on a tag to remove one. The external link icon opens the role's edit page. |
When roles are assigned, the resolved OCI image is shown beneath the field (read-only). The image is resolved from the organization default and can be overridden per role. See Images.
Network
| Field | Description |
|---|---|
| Mesh Networks | Dropdown to assign the machine to a mesh network. The external link icon opens the mesh network's detail page. |
| Tunnel Type | How peer tunnels are established: Auto (let the agent choose), WireGuard, or Geneve. |
| STUN | Toggle. Enables STUN probing for NAT traversal discovery. |
| Gateway | Toggle. Marks this machine as a mesh gateway for inter-mesh routing via BGP. |
Storage
| Field | Description |
|---|---|
| Target Disk | Dropdown listing the disks detected on the machine. Select which disk the operating system should be installed to during provisioning. |
| Kexec Installer | Toggle. When enabled, re-provisioning uses kexec to boot the installer entirely in memory without a cold reboot. This is faster than a full power cycle on compatible machines. Disable for machines with NVIDIA GPUs that require grub-reboot. |
Agent
The Agent section controls per-machine overrides for agent behavior. Both fields use a three-way dropdown:
- Account default — Inherit the organization-level setting.
- Always — Force the feature on for this machine, regardless of the account default.
- Never — Force the feature off for this machine, regardless of the account default.
| Field | Description |
|---|---|
| Auto Update | Controls whether the Durantic agent automatically updates itself on this machine. |
| Inject Agent | Controls whether the agent binary is injected into the provisioning image for this machine. |
Click Update to save changes.
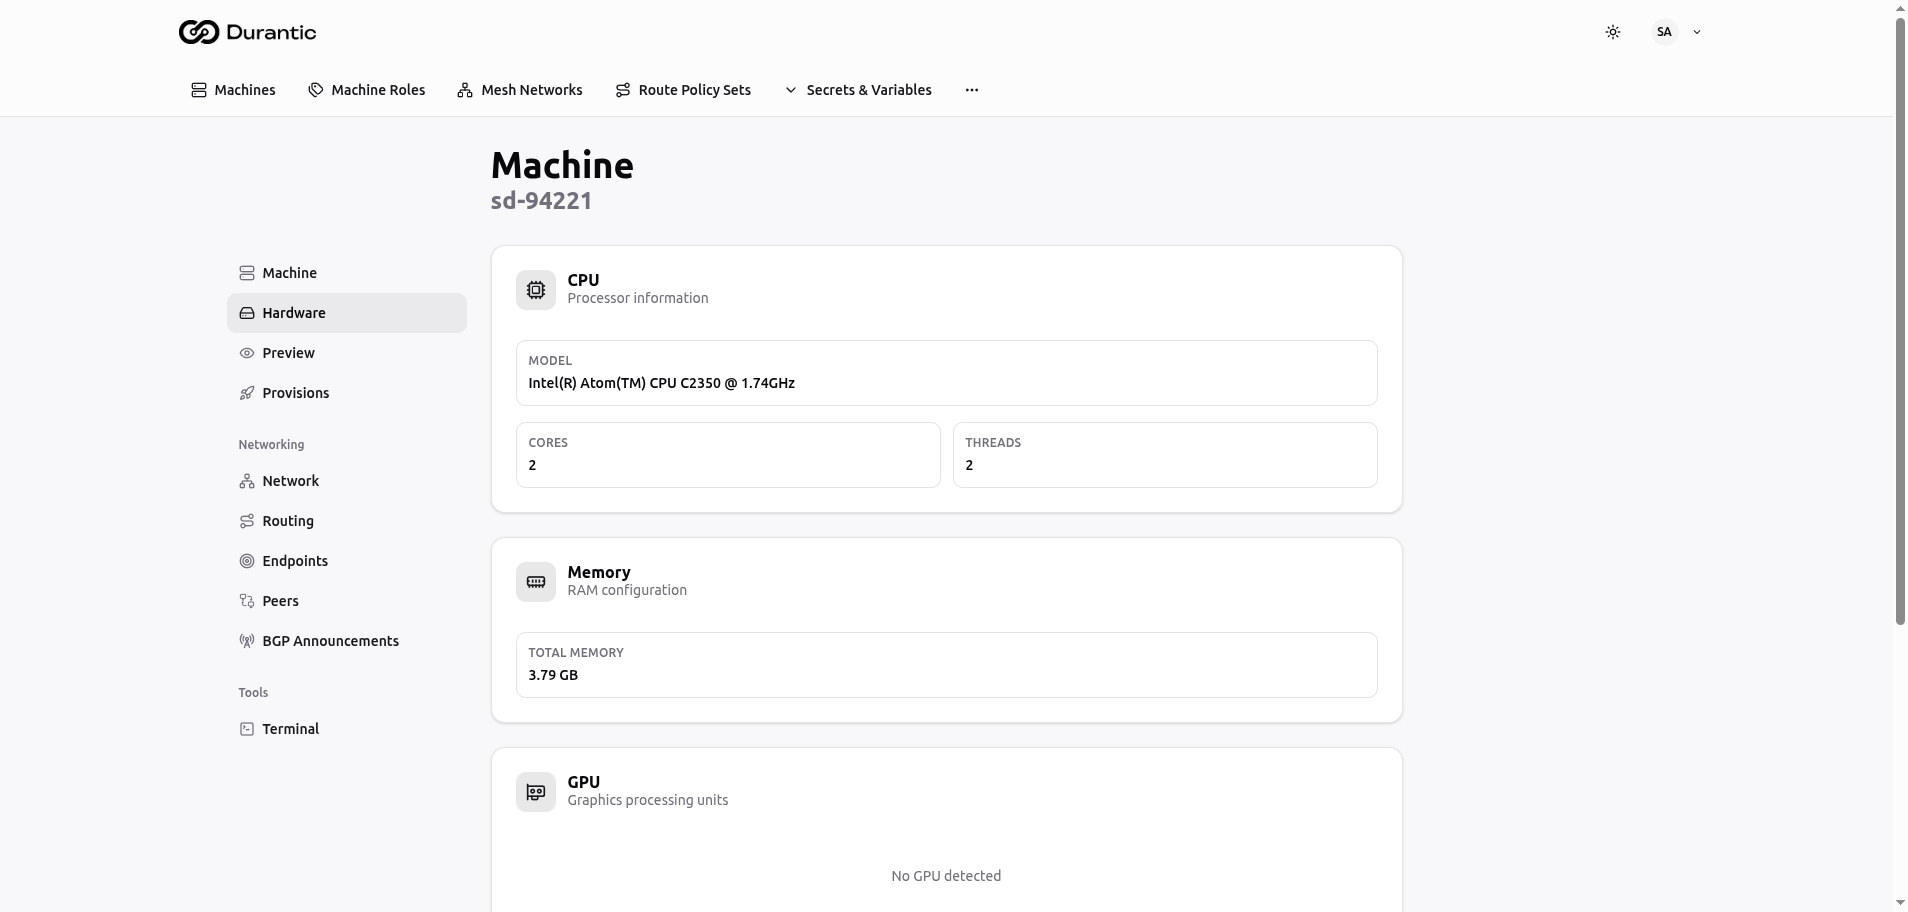
Hardware
The Hardware tab displays read-only information about the machine's physical components, as reported by the agent.
Sections:
CPU
| Field | Description |
|---|---|
| Model | Processor model name and clock speed (e.g., "Intel(R) Atom(TM) CPU C2350 @ 1.74GHz") |
| Cores | Number of physical CPU cores |
| Threads | Number of logical threads (including hyper-threading) |
Memory
| Field | Description |
|---|---|
| Total Memory | Total installed RAM in GB |
GPU
Displays detected graphics processing units. Shows "No GPU detected" if the machine has no discrete or integrated GPU recognized by the agent.
Storage
Lists all detected storage devices with:
| Field | Description |
|---|---|
| Model | Drive model name |
| Type | Storage technology (SSD, NVMe, HDD) |
| Size | Drive capacity |
Cloud Init
The Cloud Init tab shows the final cloud-init configuration that will be applied to the machine during provisioning. This is the merged and rendered result of all assigned machine roles.
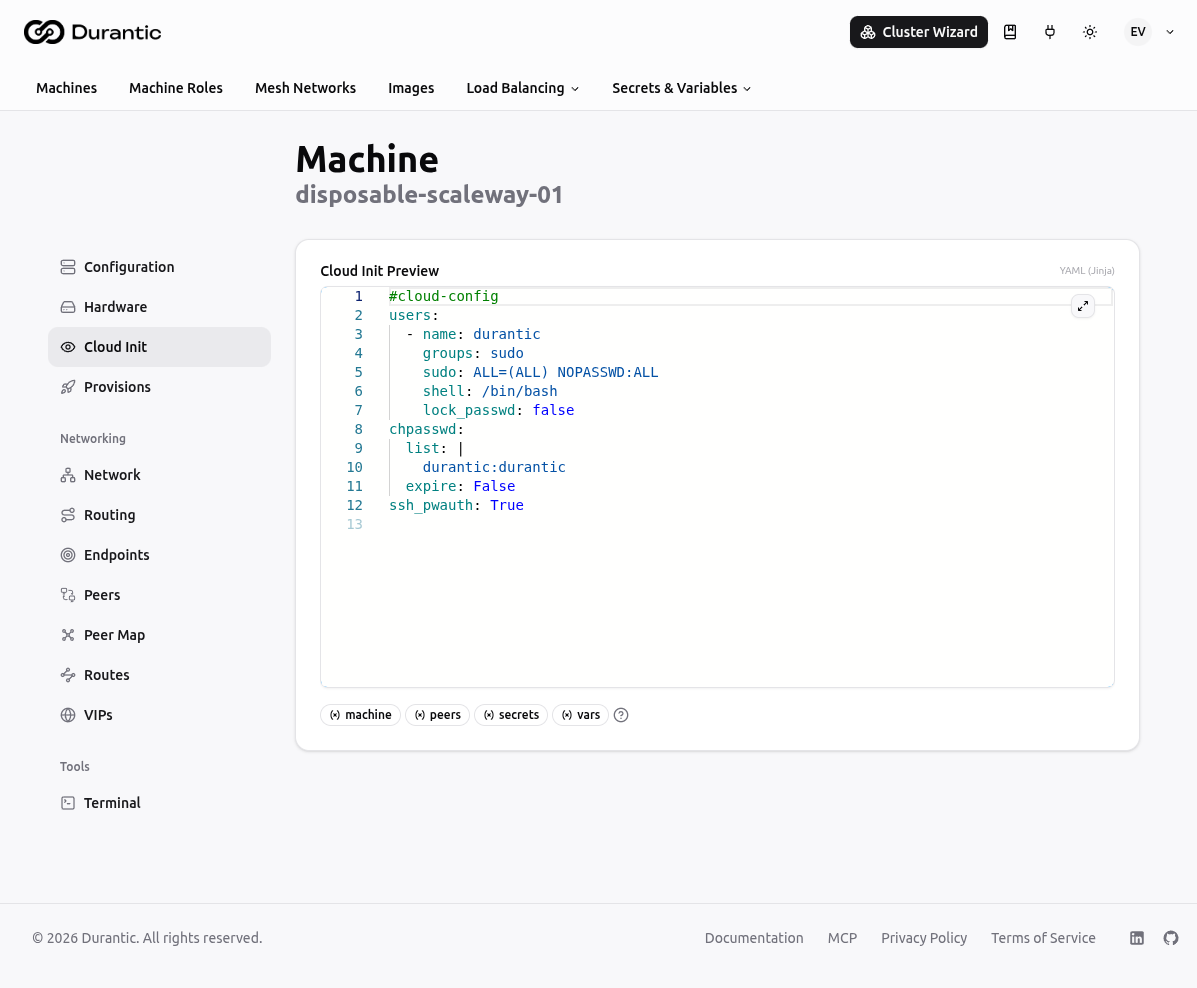
The configuration is displayed in a read-only Monaco code editor with YAML syntax highlighting and line numbers. You cannot edit the preview directly — to change the configuration, modify the machine's assigned roles.
Below the editor:
- Validation status — Shows "Valid" with a checkmark if the rendered YAML is well-formed, or displays warnings if issues are detected.
- Role tags — Badges showing which machine roles contributed to this configuration. Click a tag to navigate to that role's edit page.
Provisions
The Provisions tab shows the history of all provisioning operations for this machine and lets you trigger a new one.
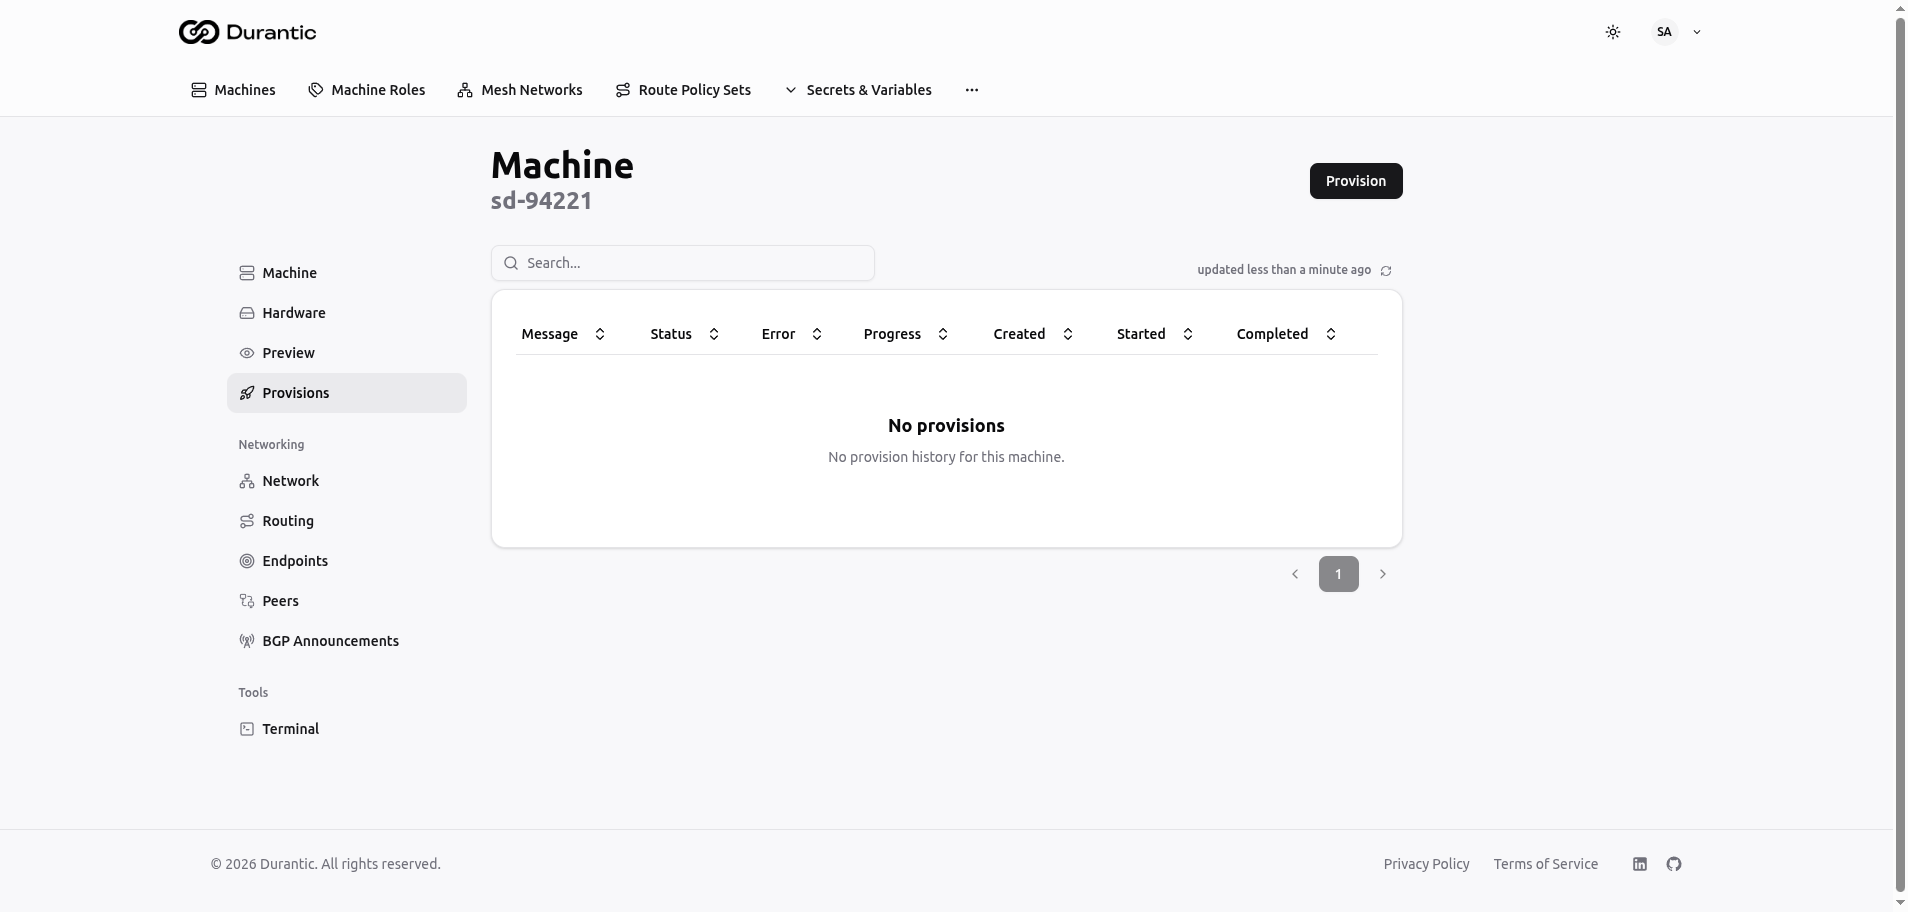
Provision Button
Click the Provision button in the top-right corner to start a new provisioning operation. The agent will stream the OCI image to the target disk and apply the cloud-init configuration.
History Table
| Column | Description |
|---|---|
| Message | A description of the provisioning step or result |
| Status | Current state of the provision (Pending, Running, Completed, Failed) |
| Error | Error message if the provision failed, empty otherwise |
| Progress | Completion percentage (0-100%) |
| Created | Timestamp when the provision was queued |
| Started | Timestamp when the provision began executing |
| Completed | Timestamp when the provision finished |
When no provisioning has been performed, the table shows "No provisions — No provision history for this machine."
Network
The Network tab provides a comprehensive view of the machine's network configuration, NAT status, and routing table as reported by the agent.
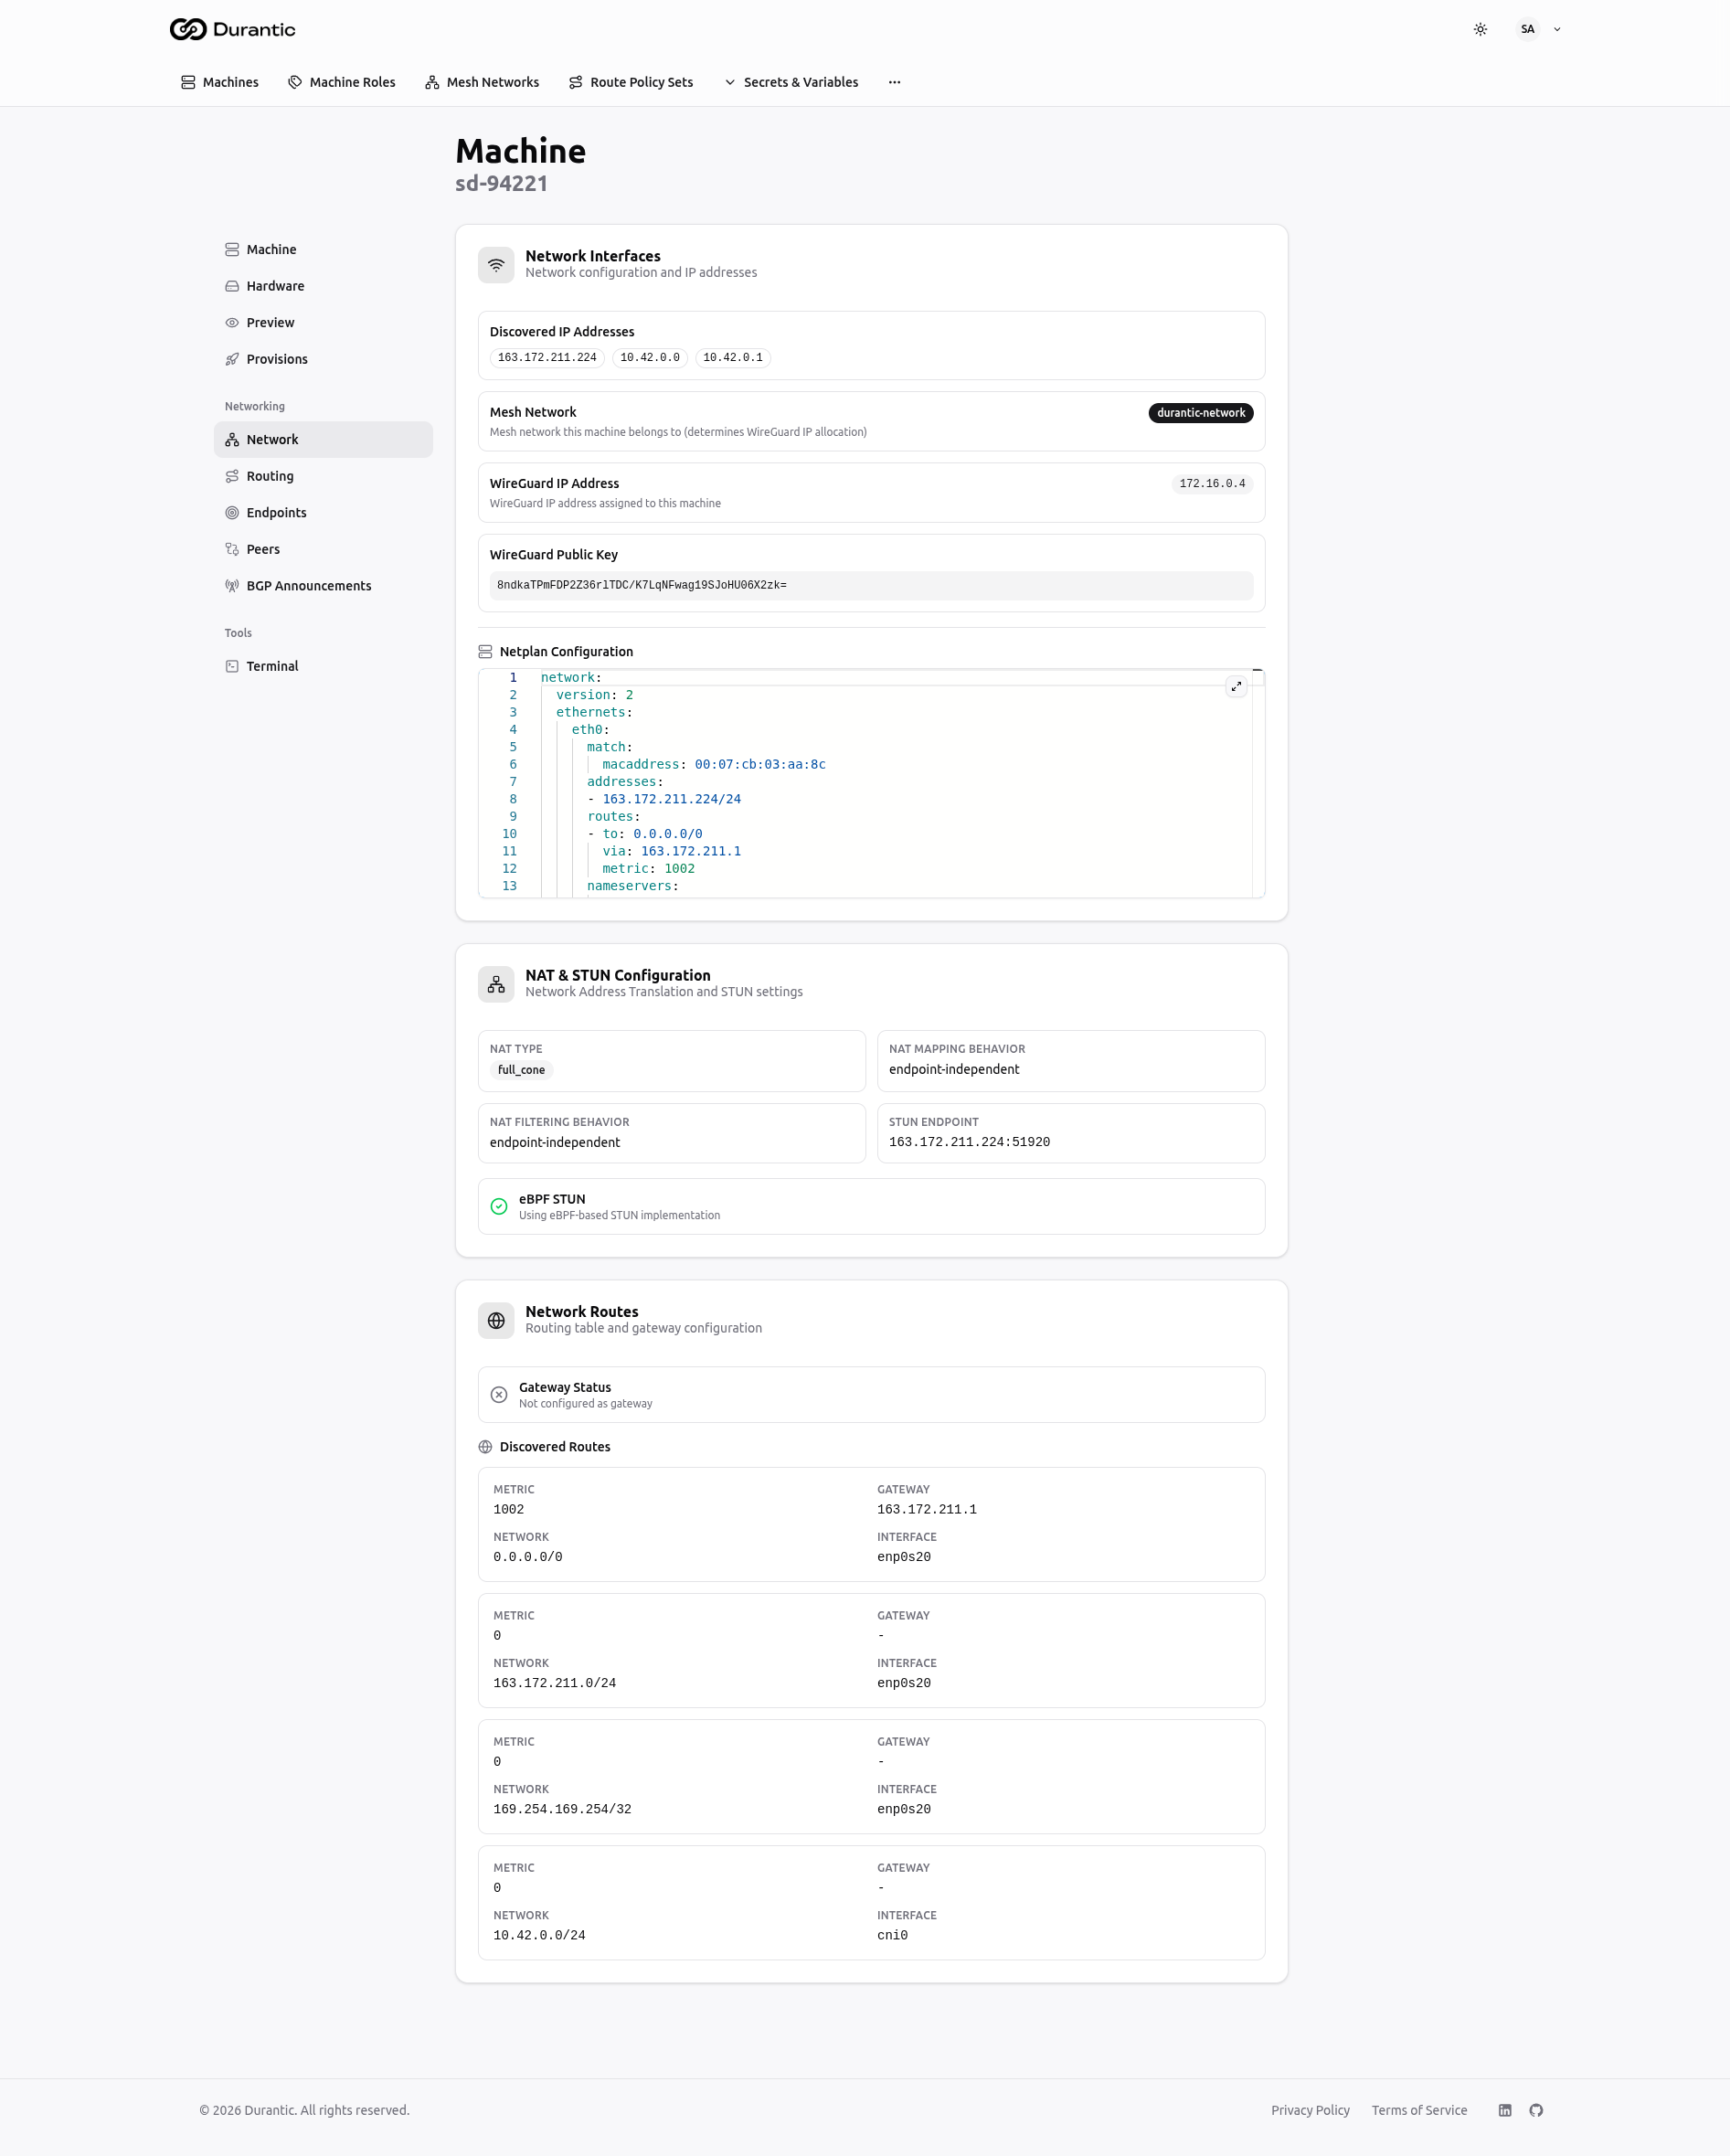
The tab is organized into four cards.
Mesh Network
| Field | Description |
|---|---|
| Mesh Network | The mesh network this machine belongs to (determines WireGuard IP allocation). |
| Mesh IP | The machine's WireGuard IP within the mesh network CIDR. |
| Gateway Status | Whether this machine acts as a mesh gateway. |
Network Interfaces
| Field | Description |
|---|---|
| Discovered IP Addresses | All IP addresses detected on the machine's network interfaces. |
| Netplan Configuration | The machine's Netplan YAML configuration displayed in a read-only code editor. |
NAT & STUN Configuration
| Field | Description |
|---|---|
| NAT Type | The detected NAT type (e.g., "Full Cone NAT"). |
| NAT Mapping Behavior | How the NAT maps outbound connections (e.g., "Endpoint Independent"). |
| NAT Filtering Behavior | How the NAT filters inbound connections (e.g., "Endpoint Independent"). |
| STUN Endpoint | The public IP and port as observed by the STUN server. |
Network Routes
The Discovered Routes list shows the machine's routing table — each route's metric, gateway, network (CIDR), and interface.
Routing (RIB)
The Routing tab displays the BGP Routing Information Base — the set of routes this machine knows about through BGP.
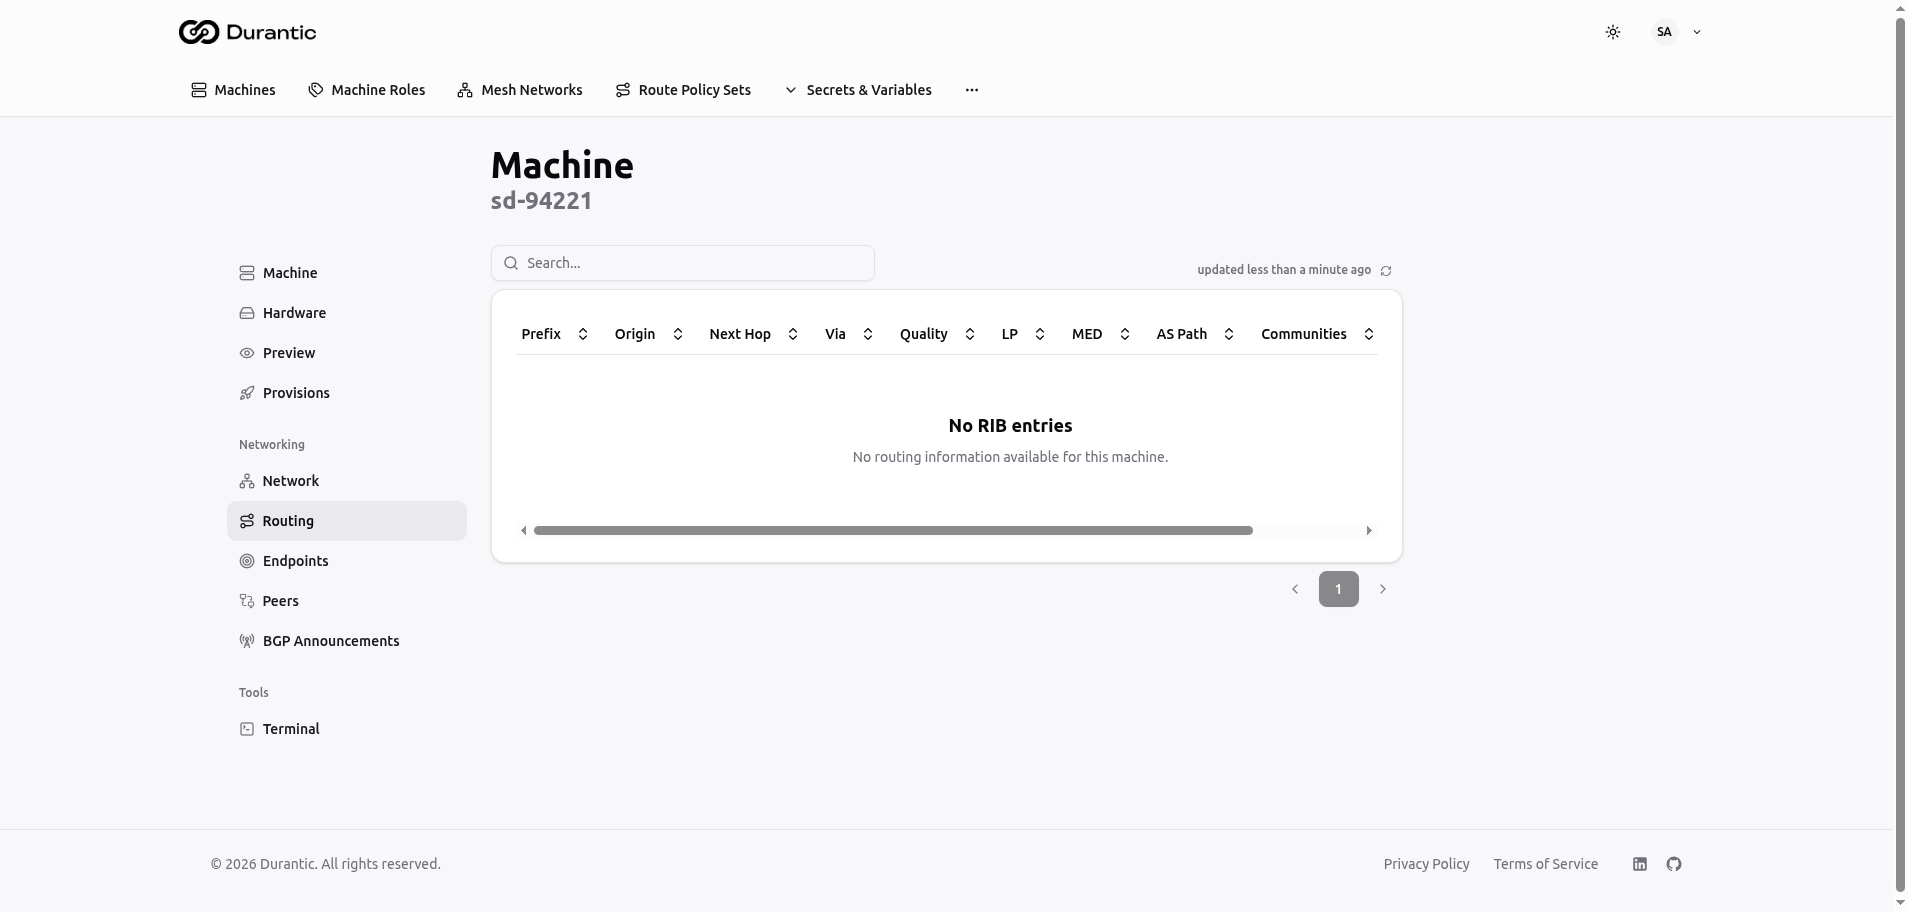
| Column | Description |
|---|---|
| Prefix | The network prefix (CIDR), with a count of how many paths exist for it. |
| Origin | How the route was learned (IGP, EGP, Incomplete). |
| Next Hop | The next-hop IP address for the best path. The advertising peer is shown below as "via …". |
| Quality | Path quality indicator. |
| Installed | Whether the route is installed in the kernel routing table. |
When a prefix has more than one path, click the row to expand it and see the alternative (non-best) paths.
When no routes are present, the table shows "No RIB entries — No routing information available for this machine."
Endpoints
The Endpoints tab shows the public-facing network endpoints observed for this machine. These are used by the mesh networking system for peer-to-peer connectivity.
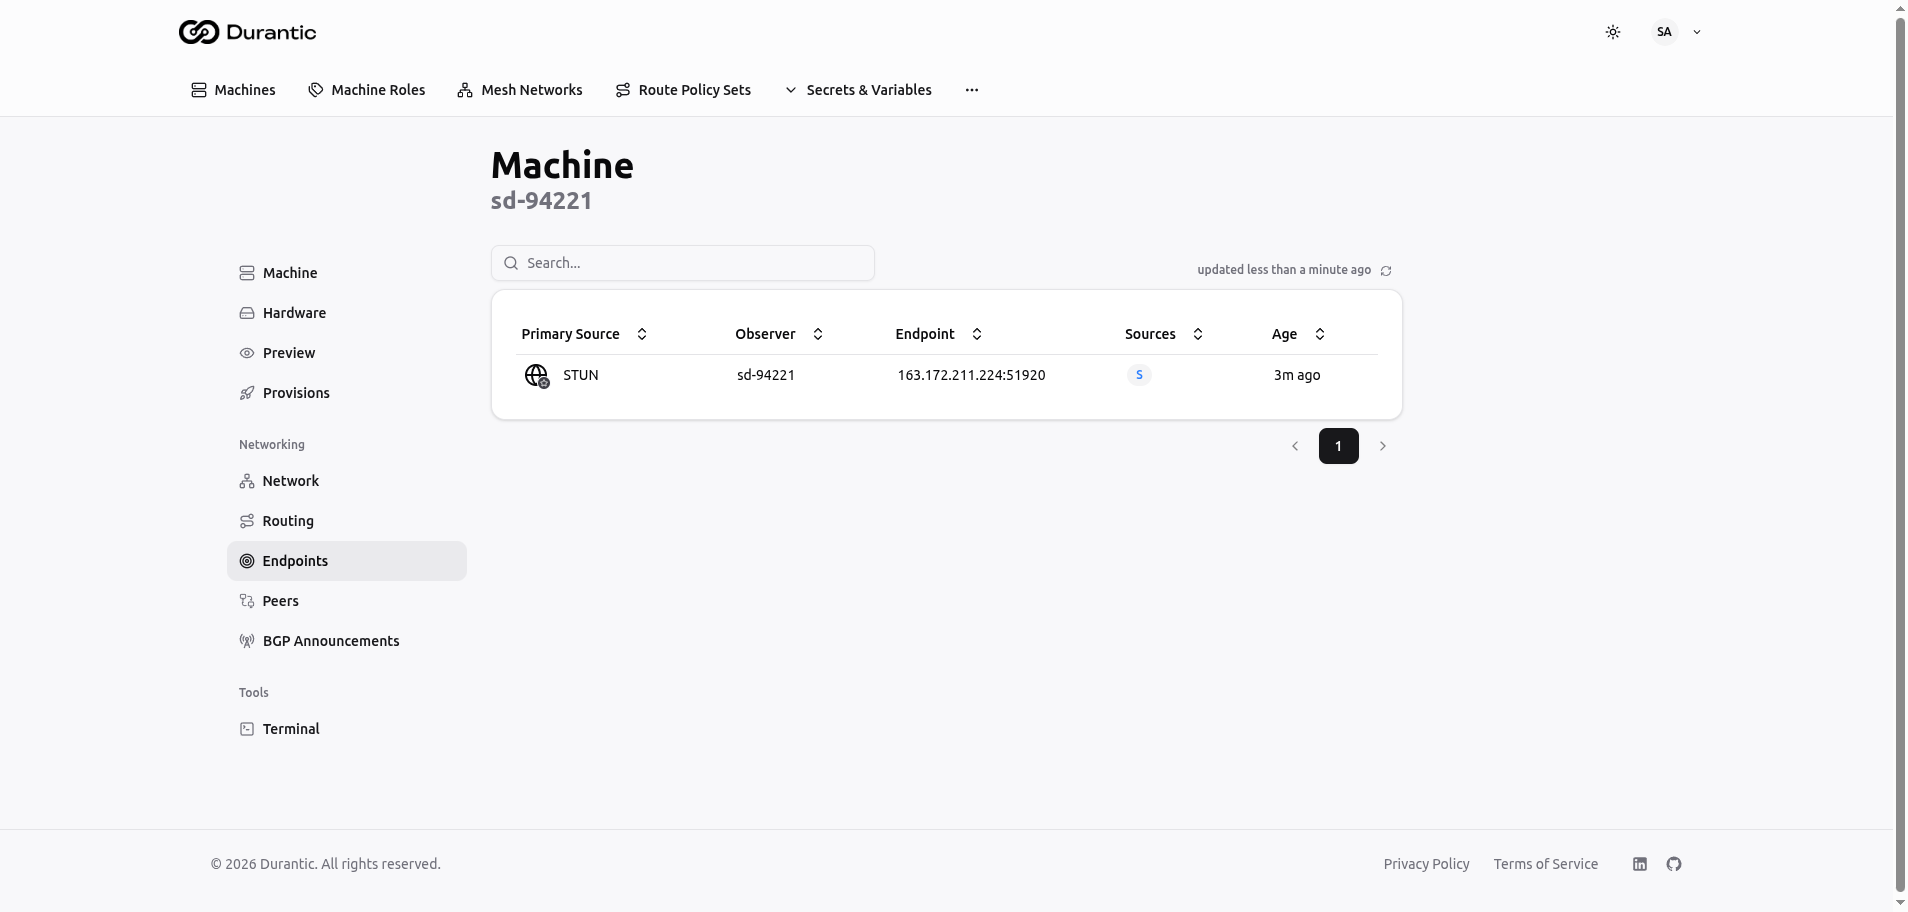
| Column | Description |
|---|---|
| Primary Source | How the endpoint was discovered: STUN (via STUN server reflection), Peer (reported by a connected peer), or Mesh (observed within the mesh) |
| Observer | The machine or service that observed the endpoint |
| Endpoint | The public IP address and port (e.g., 163.172.211.224:51920) |
| Sources | Count of distinct sources that have observed this endpoint. Click to see details. |
| Age | How long ago the endpoint was last observed |
Peers
The Peers tab shows the connectivity status between this machine and every other machine in its mesh network.
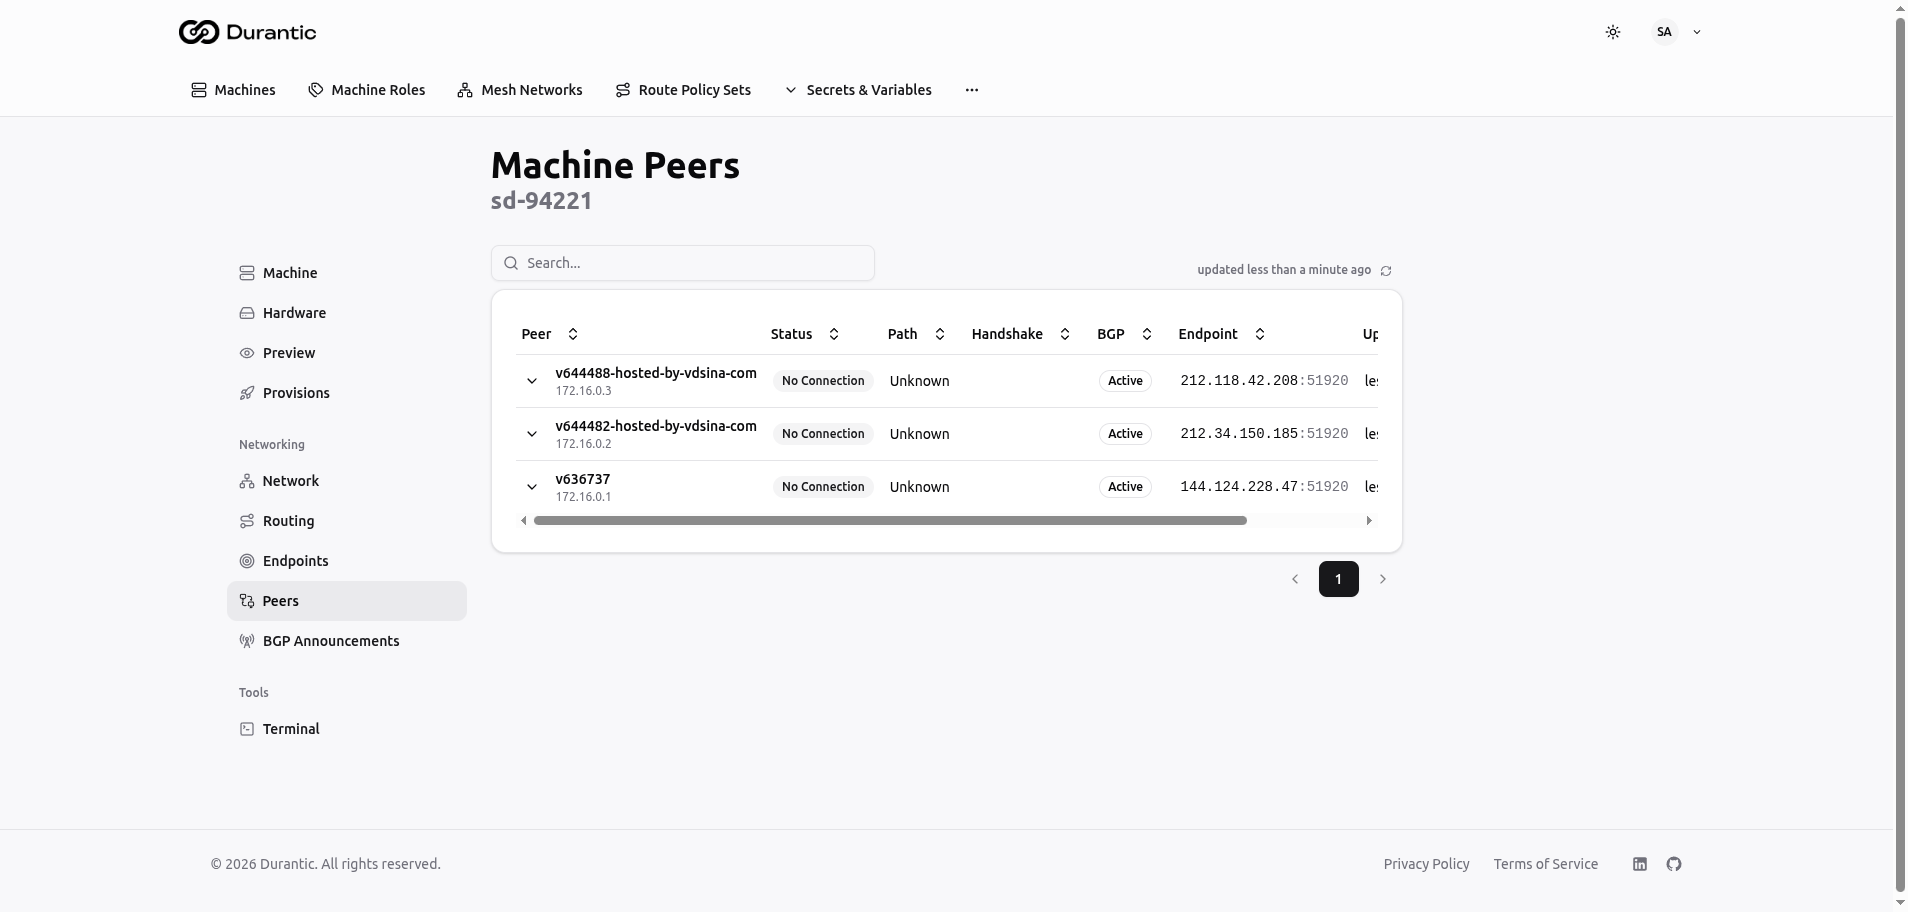
| Column | Description |
|---|---|
| Peer | The peer machine's hostname and WireGuard IP address |
| Status | Connection state: Connected (active tunnel), Partial (one direction working), No Connection (tunnel not established) |
| Path | How traffic reaches the peer: Direct (peer-to-peer) or Transit (relayed through another machine, with the transit IP shown) |
Each row has an expand arrow on the left. Click it to reveal bidirectional metrics — each measured in both directions (this machine → peer and peer → this machine): Path Type, Handshake (time since last WireGuard handshake), Endpoint, Traffic (bytes sent/received), BGP Session (state and route counts), and Last Seen.
Peer Map
The Peer Map tab displays a visual topology diagram of the mesh network as seen from this machine.
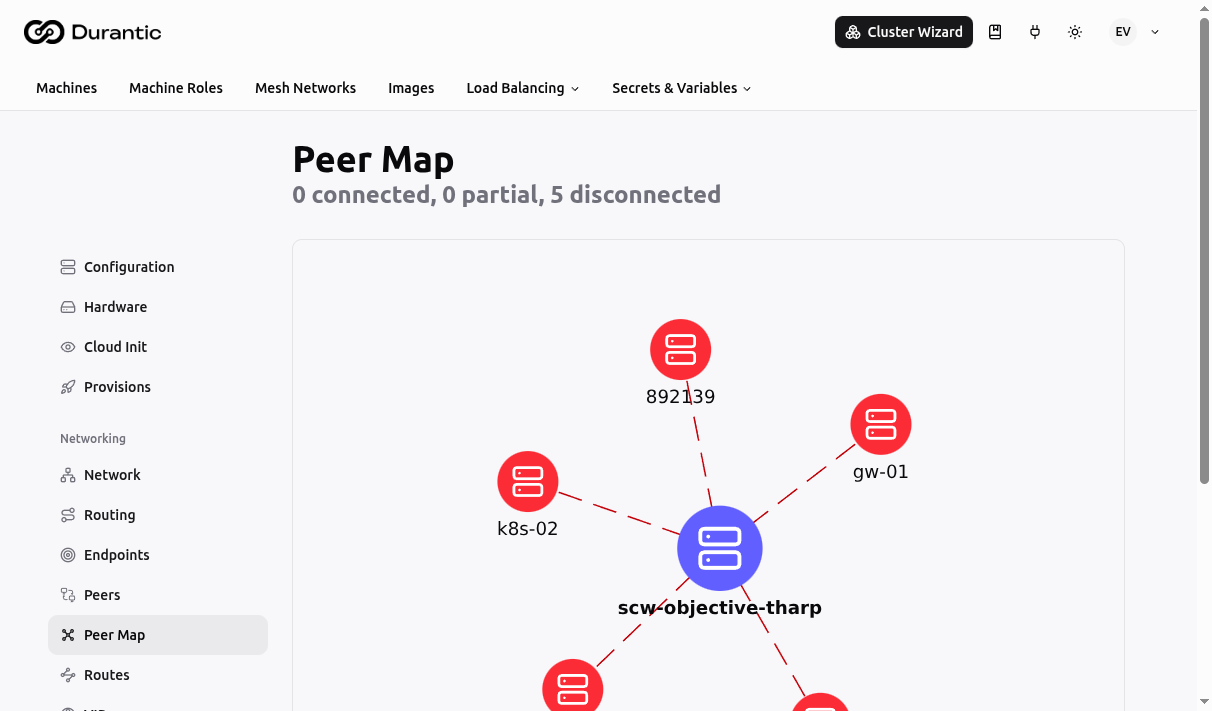
The map shows this machine at the center with lines connecting to its peers. Connection quality and path type (direct vs. transit) are reflected in how the edges are rendered.
Routes
The Routes tab shows the BGP routes this machine is assigned to announce. These are the global Routes that include this machine in their machine list.
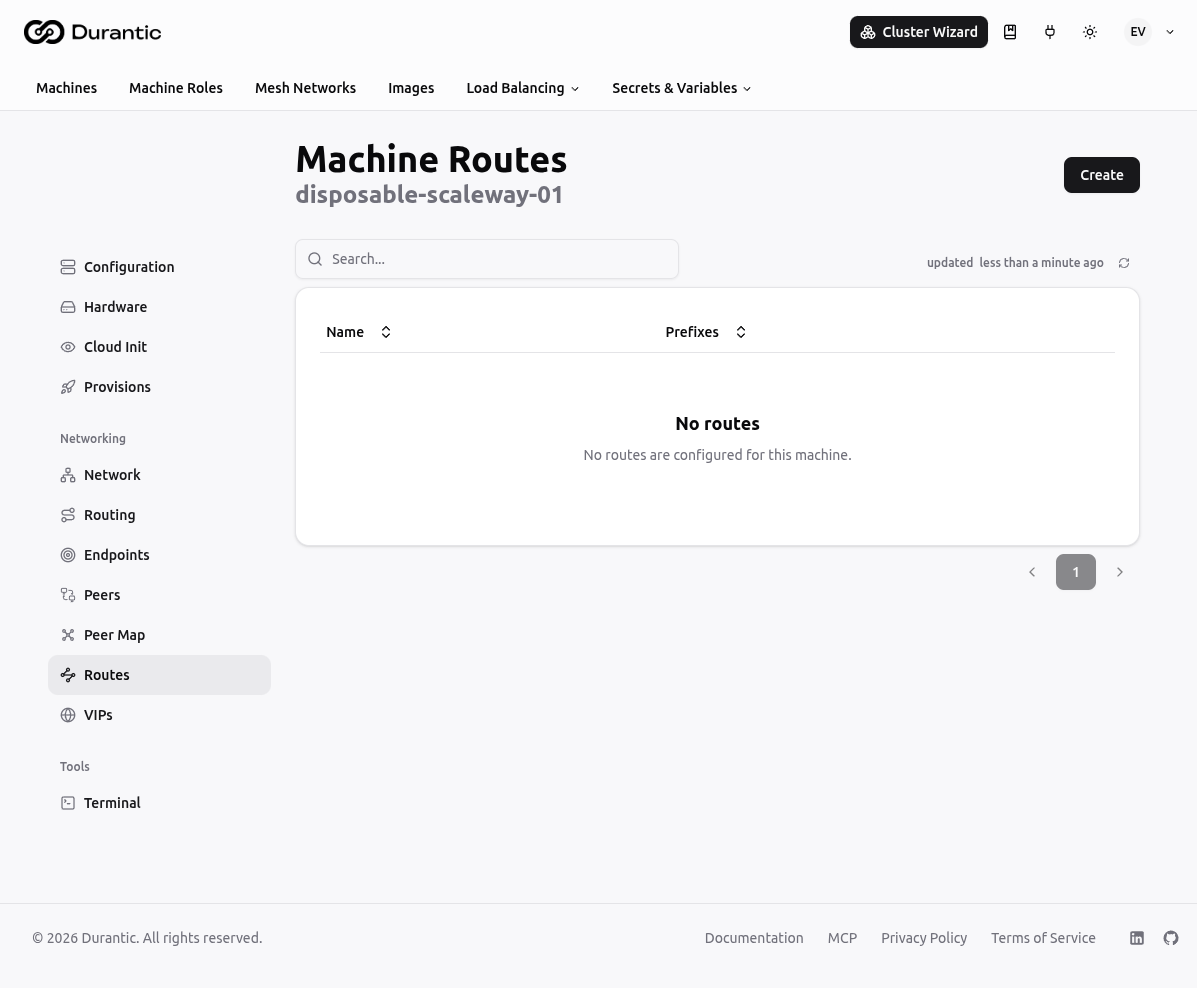
You can also create new routes directly from this tab — they will be scoped to this machine automatically.
VIPs
The VIPs tab shows the Virtual IPs this machine is assigned to announce. These are the global VIPs that include this machine in their machine list.
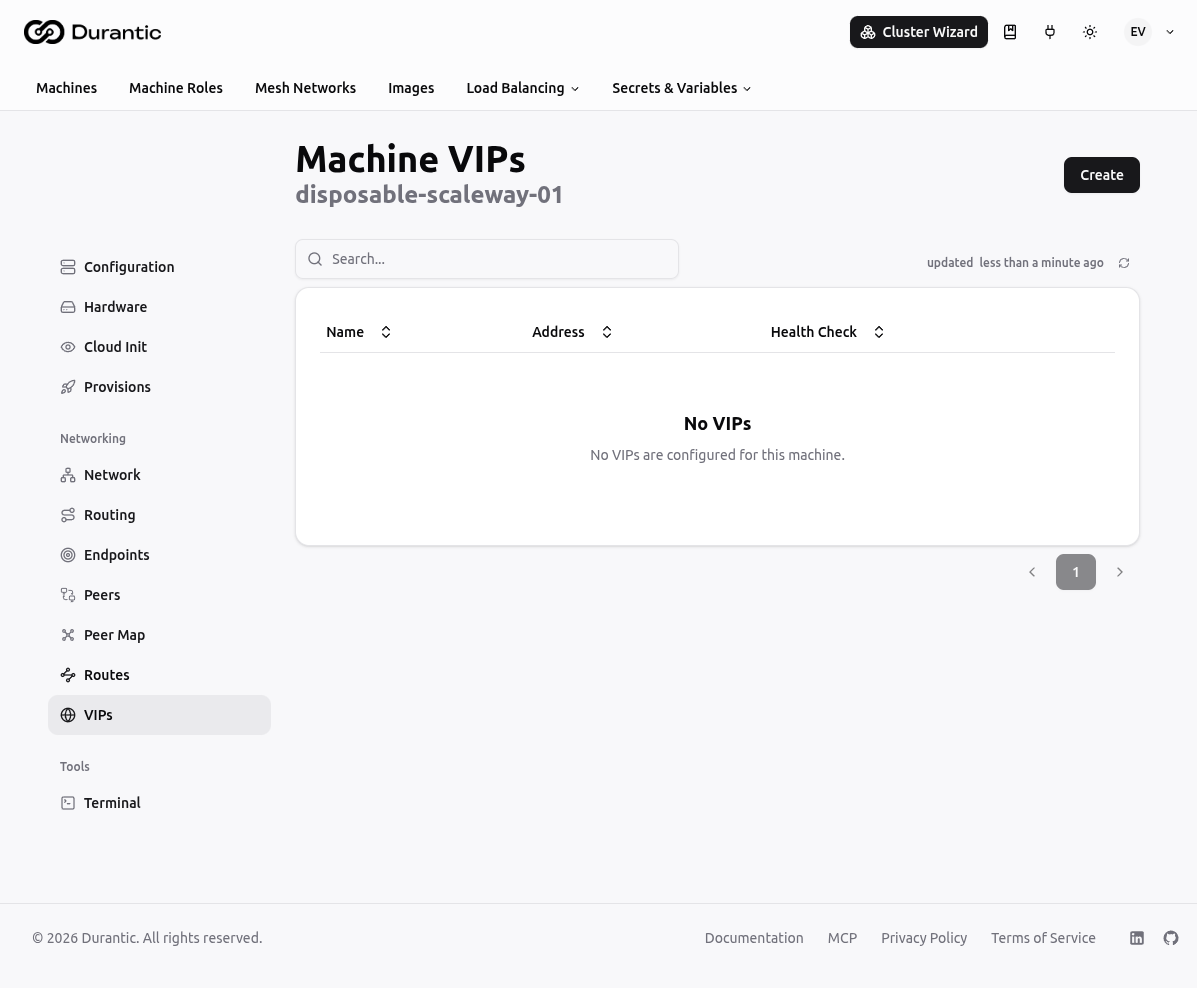
You can also create new VIPs directly from this tab — they will be scoped to this machine automatically.
Terminal
The Terminal tab provides an interactive remote shell session to the machine, directly from the dashboard.
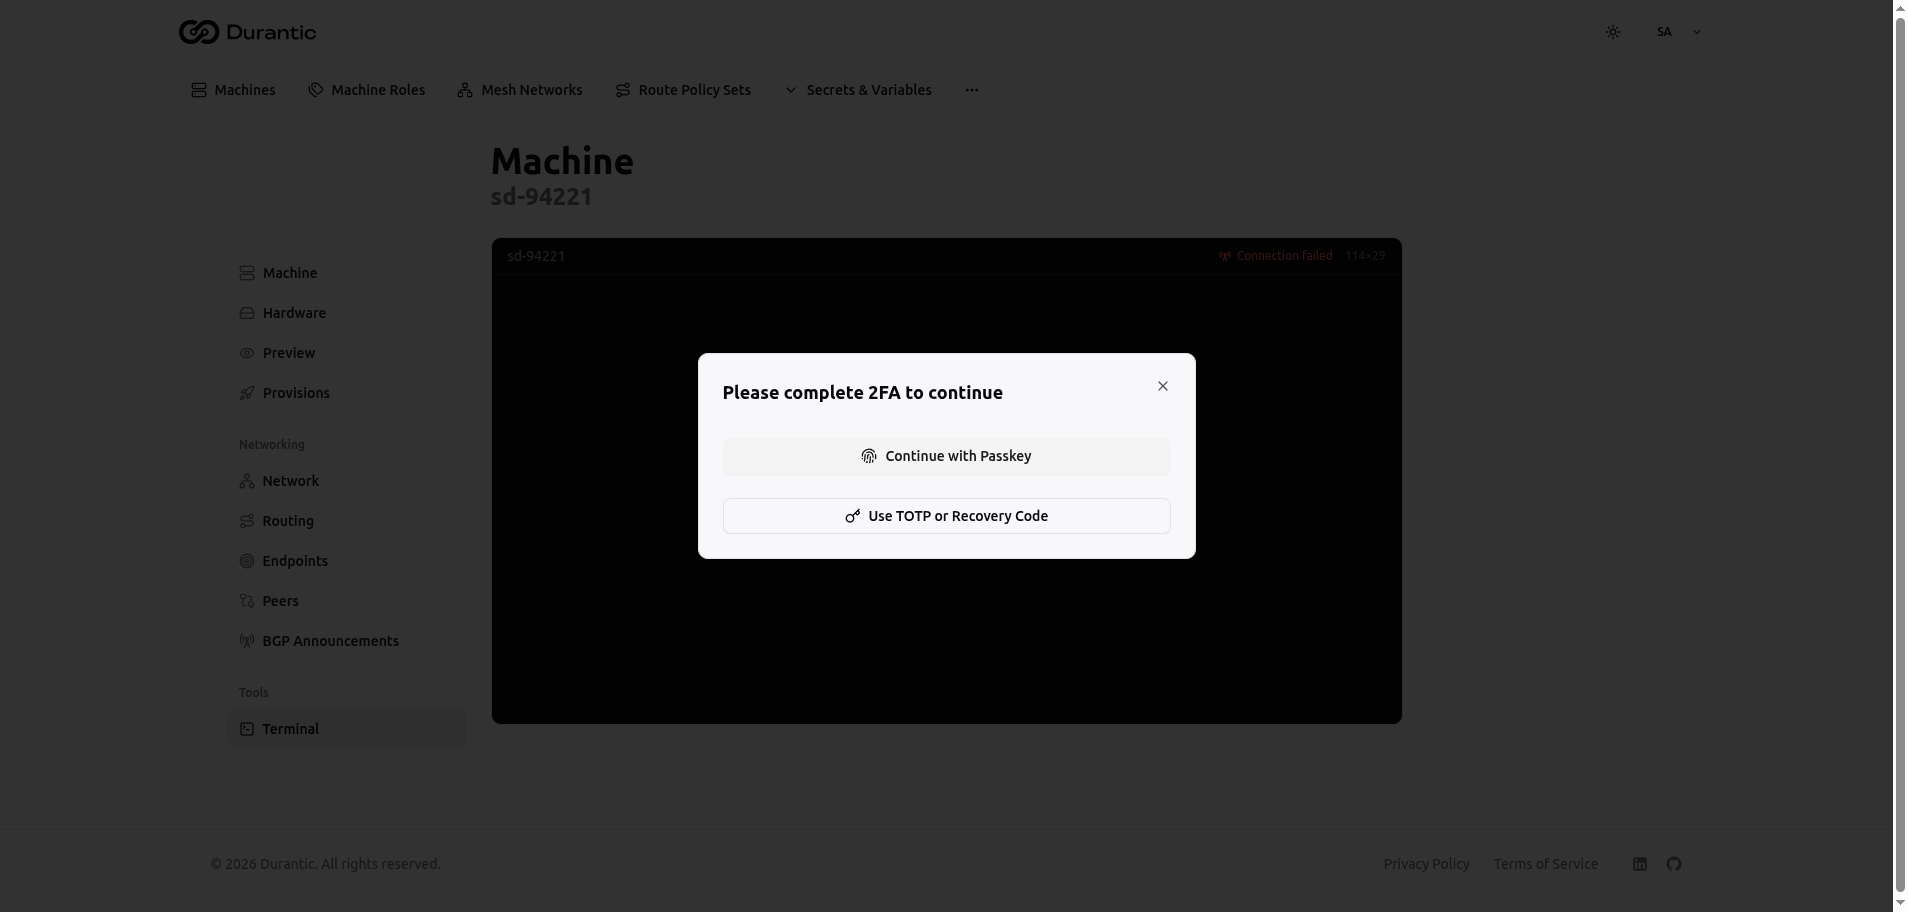
Two-Factor Authentication
Terminal access requires 2FA verification each time you connect. A dialog appears with two options:
- Continue with Passkey — Authenticate using a WebAuthn-compatible device (hardware key, fingerprint sensor, or platform authenticator).
- Use TOTP or Recovery Code — Enter a six-digit code from your authenticator app or a recovery code.
You must have at least one 2FA method configured in your account security settings before you can use the terminal.
Using the Terminal
After completing 2FA, a brief "Initializing terminal session..." message is shown while the connection is established, followed by a full PTY shell session in the browser. The terminal header bar shows:
- Machine hostname — Displayed on the left.
- Connection status — Displayed on the right. Shows "Connection failed" in red if the machine is offline, or the active connection state.
If the connection drops, use the reconnect button to re-establish the session. A new 2FA verification may be required on reconnect.